1. Add blocks
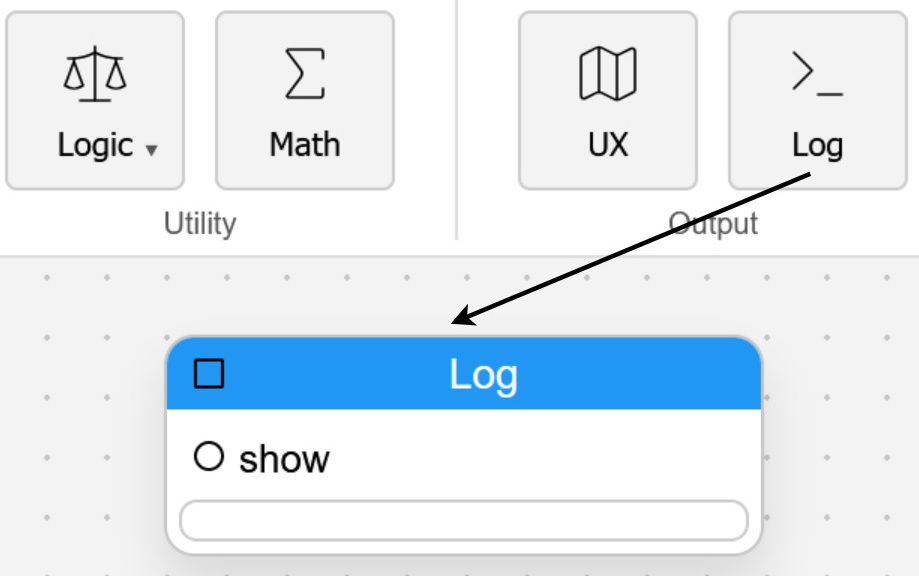
Choose a block from the ribbon and place it in the workspace. Start with simple blocks such as Text, Number, Math, Compare, or Log.
Aiigle lets you build interactive programs by combining visual blocks. Each block performs one task: it can create a value, load data, transform text, compare numbers, call an AI model, write a log, or send data to another system. You build a program by placing blocks in the editor, connecting their ports, configuring the blocks, and pressing run.
This guide walks you through the basic idea with simple examples. You do not need to write code to get started, but Aiigle still shows you how the workflow behaves through the Log and Code panels.
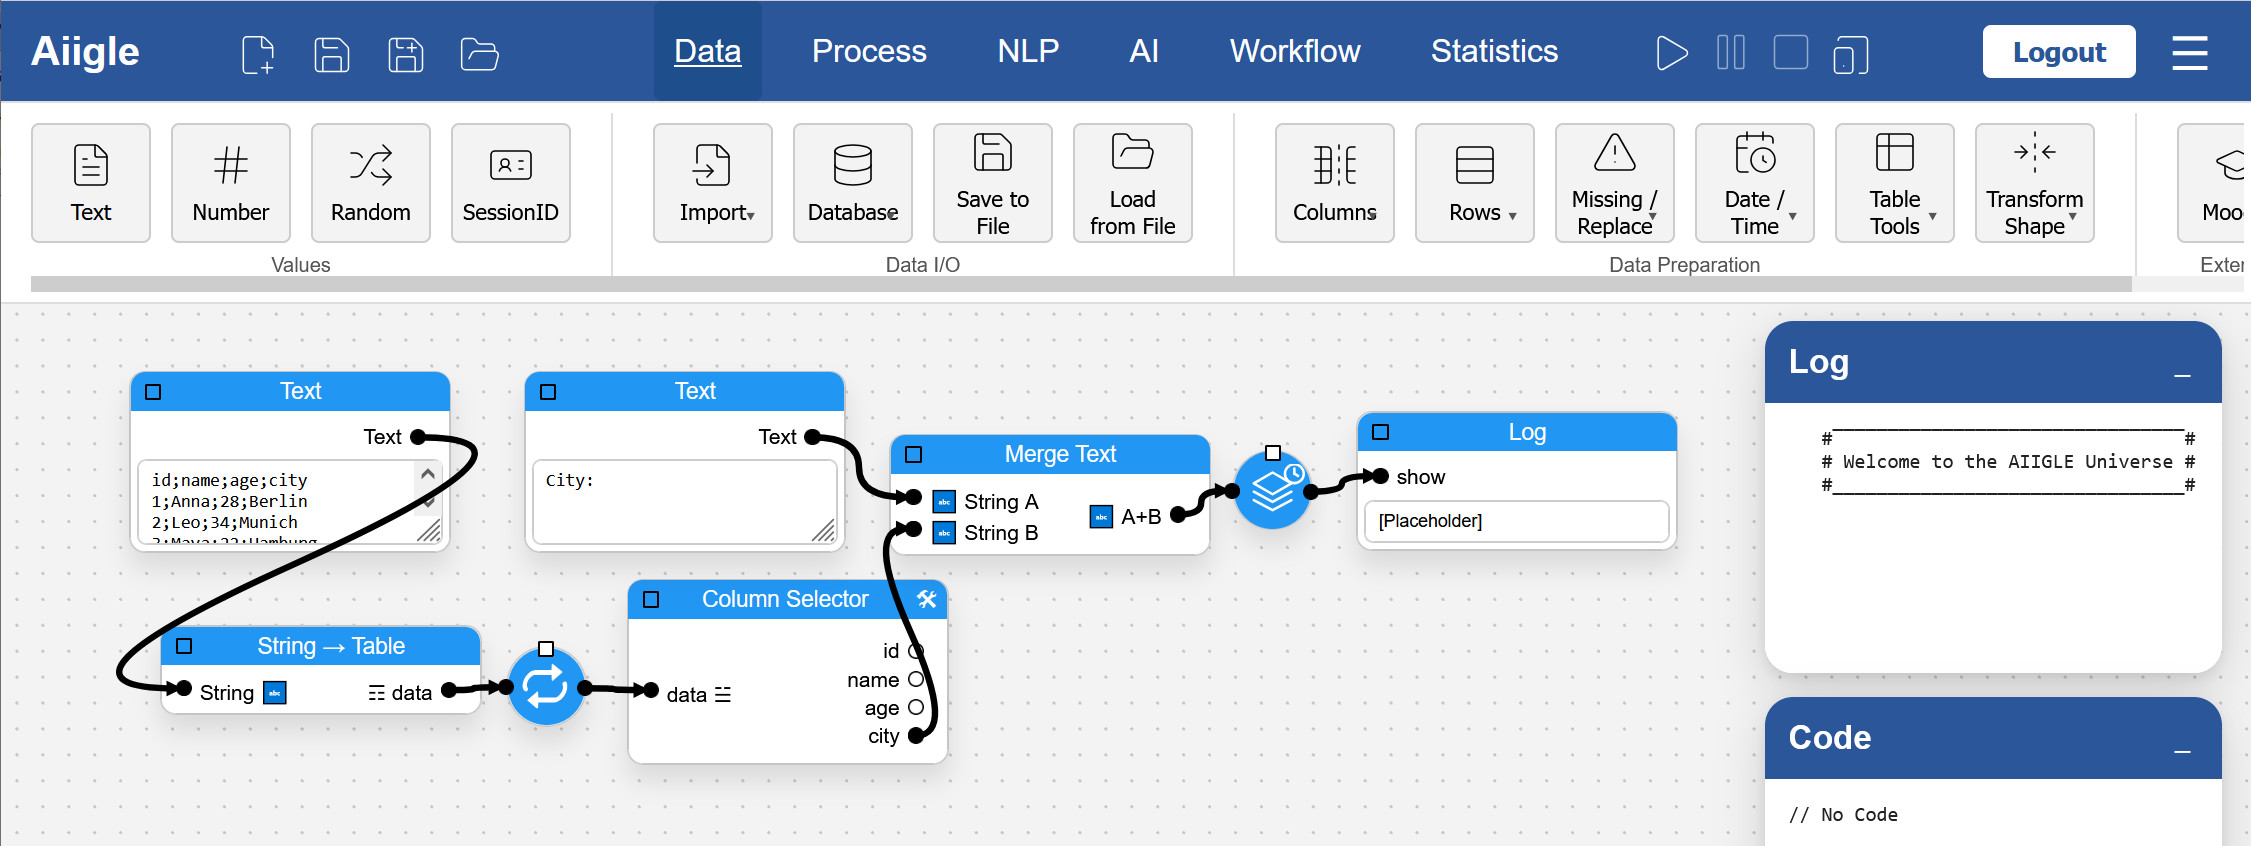
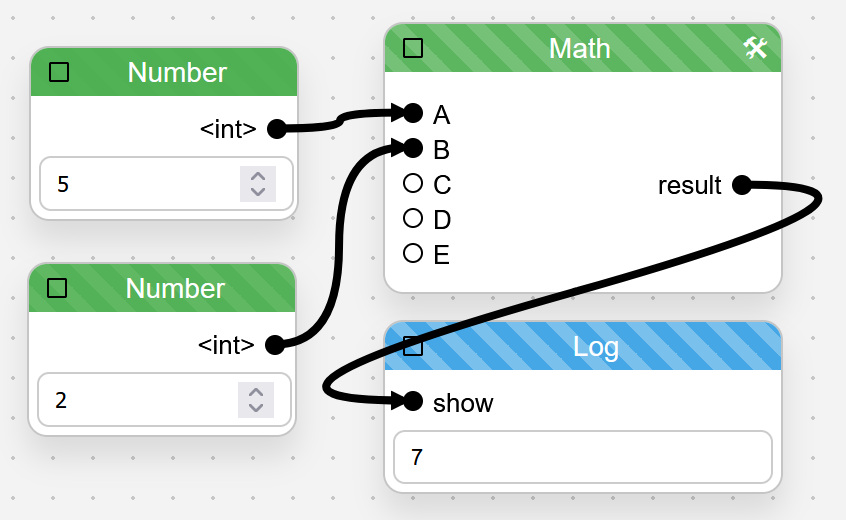
A workflow is a chain of connected blocks. Data usually flows from left to right: one block produces an output, the next block receives it as input, and the result continues through the graph.
Choose a block from the ribbon and place it in the workspace. Start with simple blocks such as Text, Number, Math, Compare, or Log.
Drag from an output connector to an input connector. Connections define which result is passed to which block.
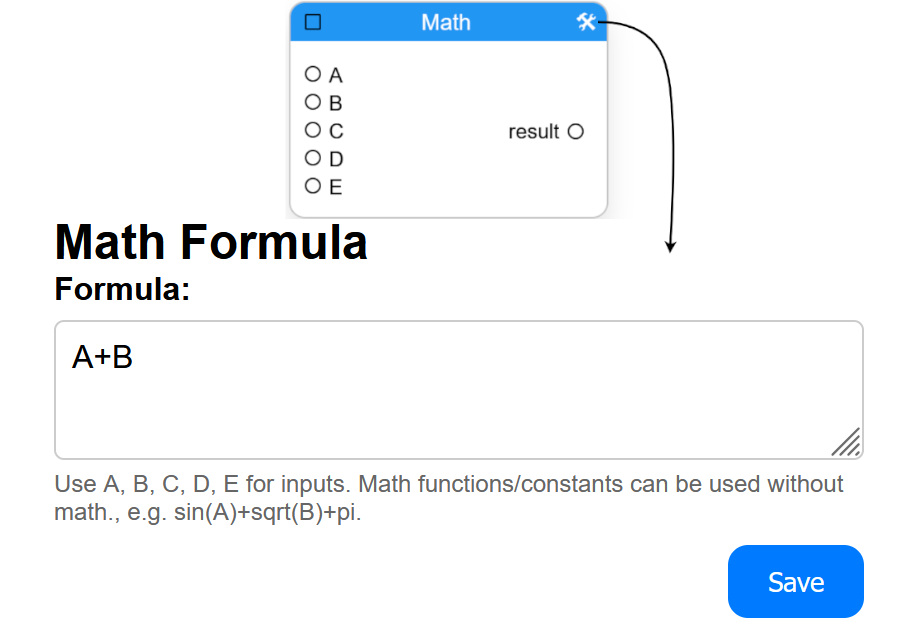
Open a block’s settings and enter the value, formula, column name, URL, or option that the block needs.
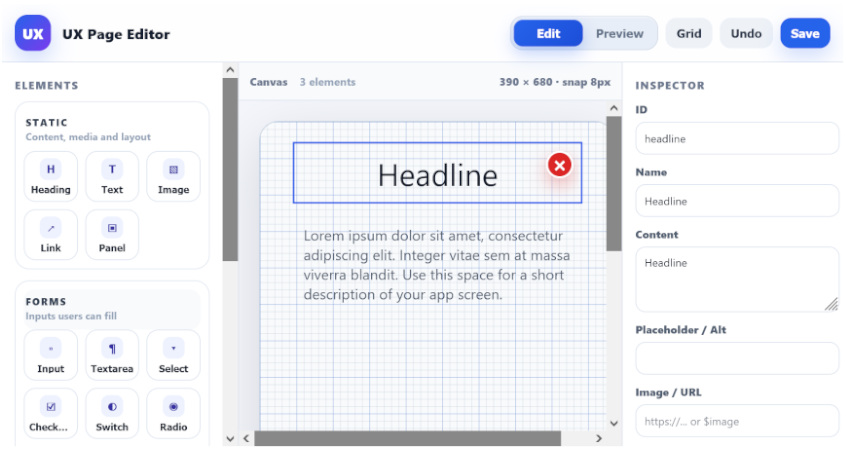
Use UX blocks to create simple user interfaces for your workflow. Configure labels, inputs, buttons, and outputs so users can enter values, start actions, and see results without editing the graph itself.
Press the run button and watch the workflow while it is running. Active blocks are highlighted, completed blocks change their state, and connected log blocks show the current output.

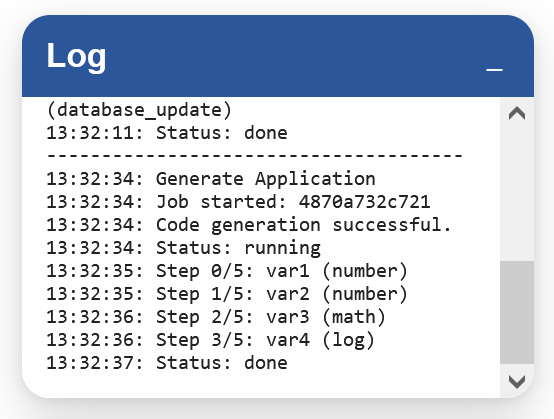
Use the Log panel to follow runtime messages, errors, warnings, and results. Add Log blocks to inspect the data they receive.
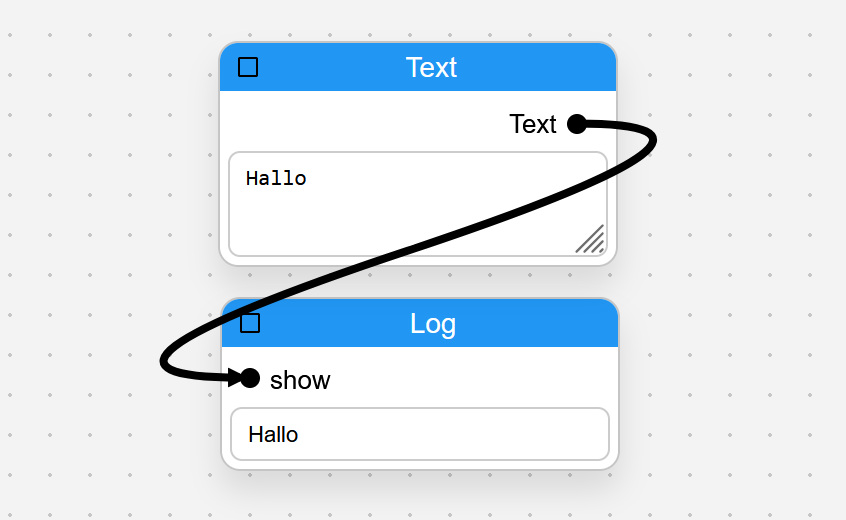
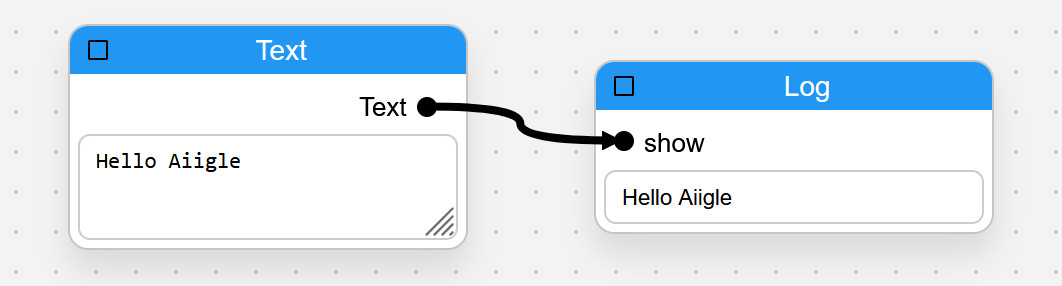
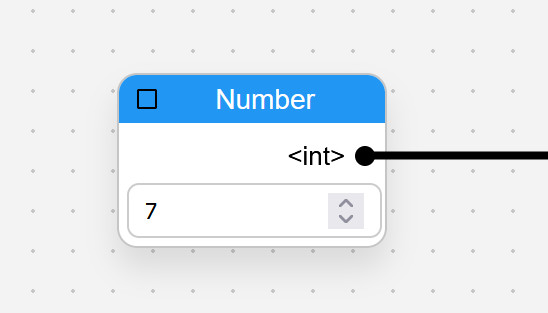
The smallest useful program contains a value block and a log block. The value block creates data, and the log block shows it.
 .
.The Log panel should now show the text that came from the Text block. This is the simplest form of data flow: one block creates a value, another block receives it.
You can create small logic programs by combining Number, Compare, Assert, Switch, and Log blocks. The following example checks whether two numbers are equal.
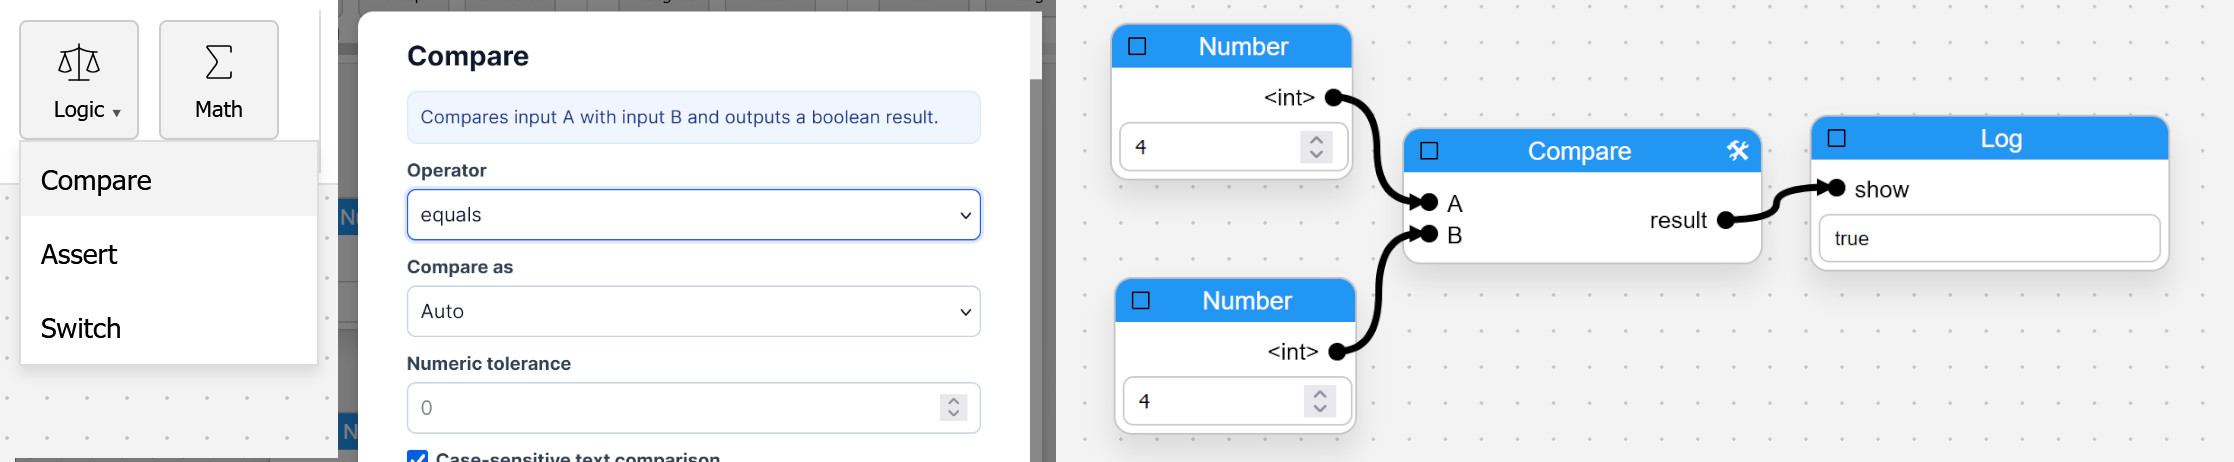
The Compare block returns whether the condition is true or false. This is useful when you want to branch a workflow, validate data, or stop a graph when a condition is not fulfilled.
You can also use the If/Then block if you want to use more complex conditions (like A == B).
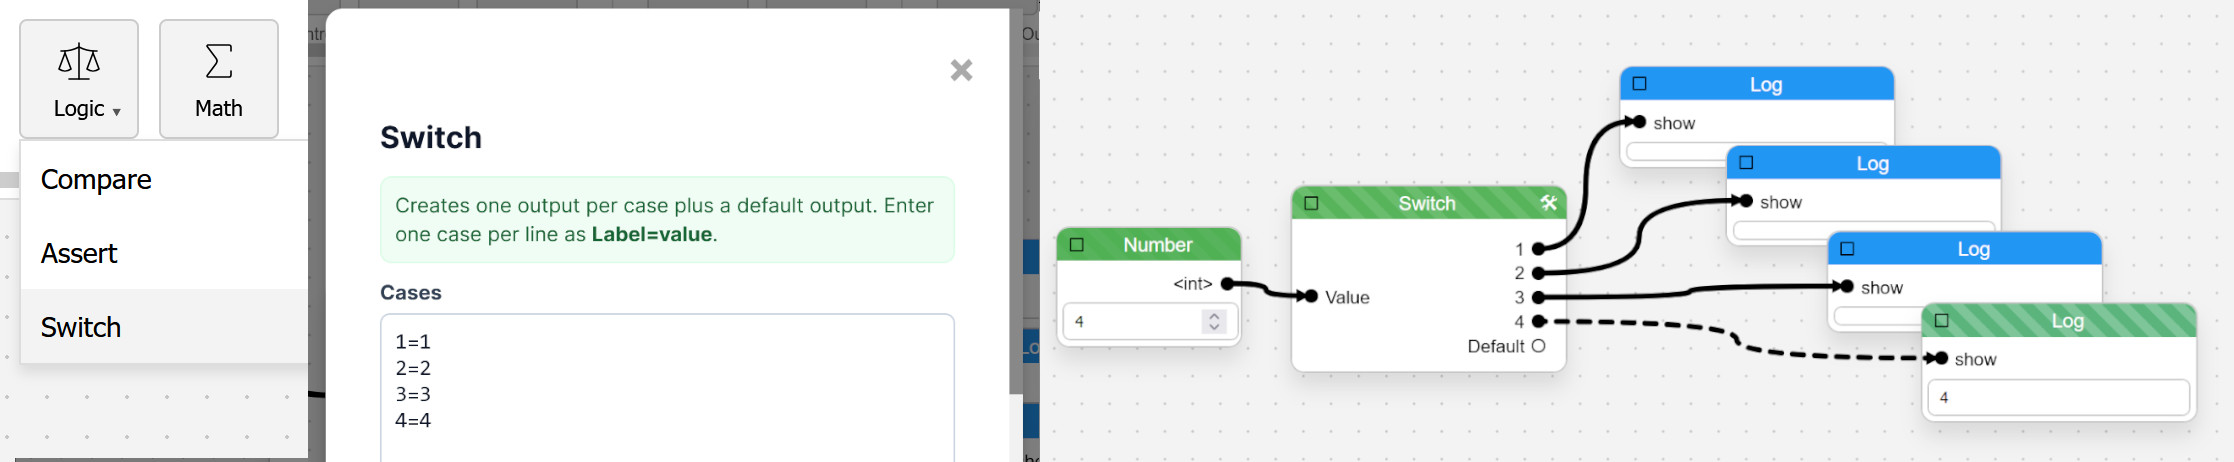
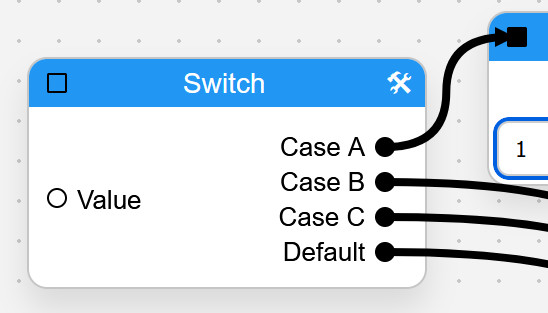
A Switch block chooses one of several outgoing paths. It is useful when the next step depends on a value, such as a category, status, number, or user choice.
Only the matching output path should fire. If no case matches, the default path can be used, if it is configured and connected.
A For block lets you run the same part of a workflow for every item in a list or table. A Collector block gathers the results again after all items have been processed.
id;name;age;city
1;Anna;28;Berlin
2;Leo;34;Munich
3;Maya;22;Hamburg
4;Jonas;41;Cologne
;.
City: Berlin, City: Munich, and so on.
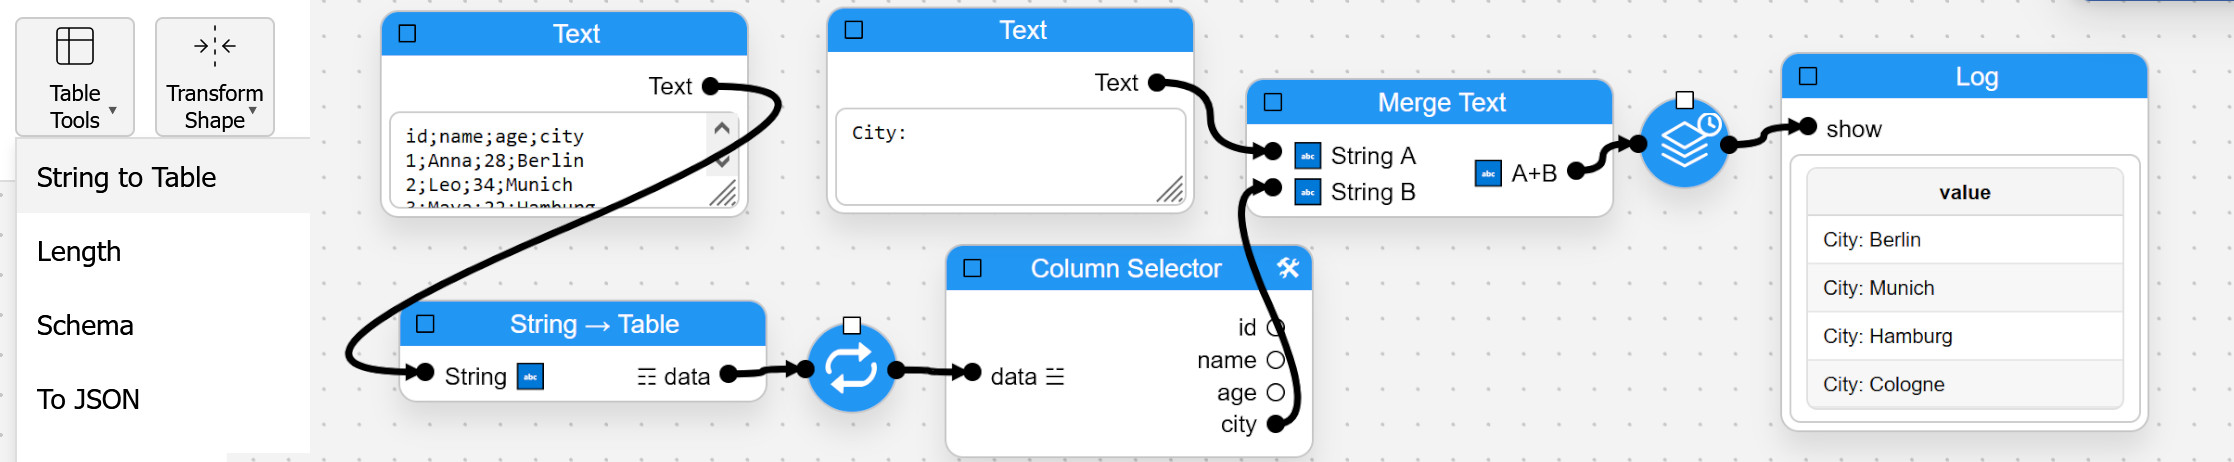
In this example, the original table is used as input. The workflow processes each row separately, extracts the city, creates one result per row, and then collects those results.
AI models can be integrated directly into workflows. The LLM block sends a prompt to a language model and returns the generated response.
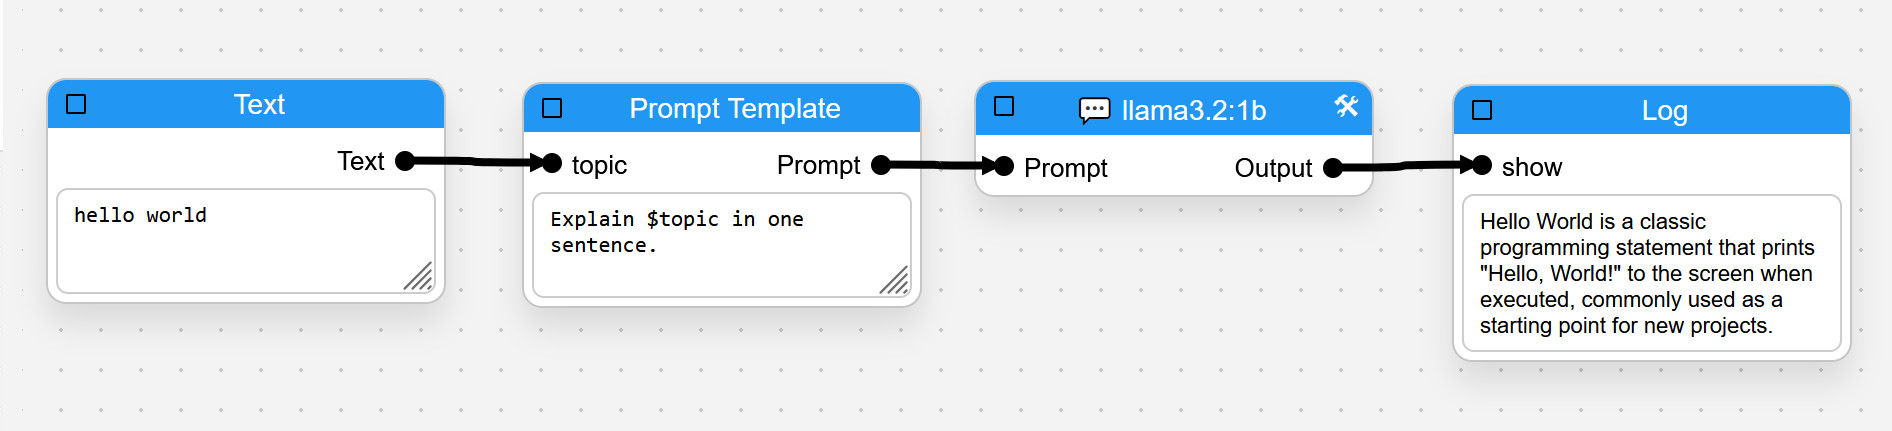
The LLM block receives the prompt, generates a response, and passes the result to the next block. You can combine LLM blocks with tables, Moodle data, APIs, UX blocks, or workflow logic to create more advanced applications.
Connectors are the small points on a block. Inputs are usually on the left side, outputs are usually on the right side. Some blocks have more than one input or output.
Data inputs receive values from previous blocks. A block normally waits until its required connected inputs are available. This ensures each step has the information it needs before processing begins.
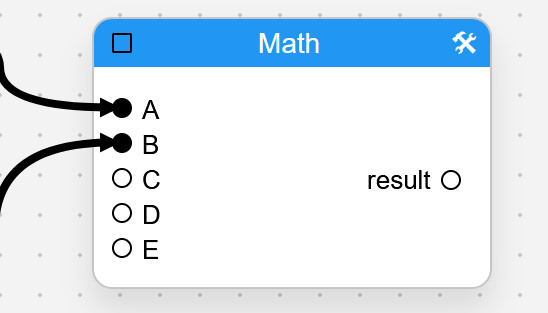
Data outputs send the result of a block to the next block. They pass values such as text, numbers, tables, rows, files, API responses, or generated results through the workflow.
Some blocks can wait for a trigger before they run. If a trigger input is connected, the block starts only after that trigger fires, even when its data inputs are already available.
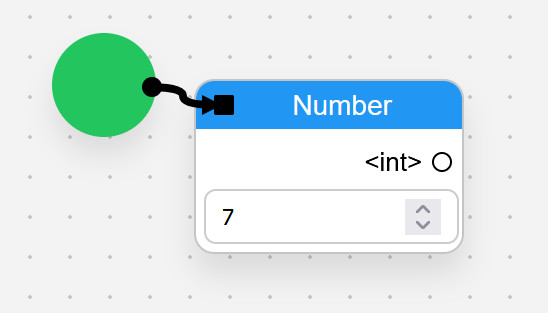
Blocks such as Switch or If can send execution to different paths depending on a condition. Always connect with trigger input ■ to control execution.
Each output can contain a different result, such as selected columns, model scores, transformed data, or separate parts of the same calculation.
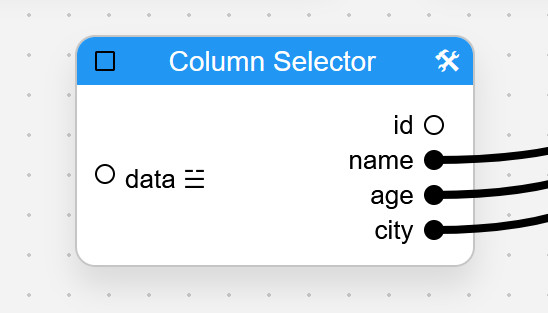
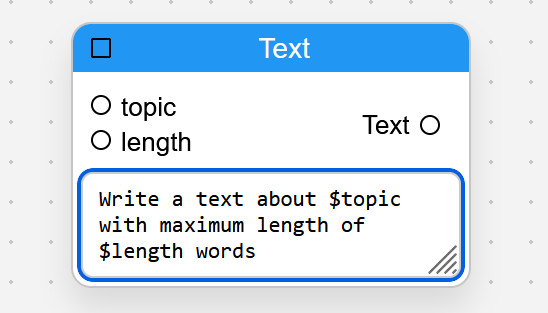
With $ you can add flexible ingoing nodes as placeholders, which are filled with the ingoing values. They are useful for dynamic blocks with changing contents.
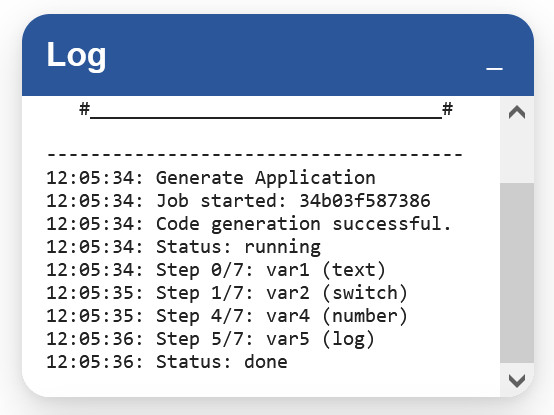
The panels on the right help you understand your program while it runs.
Shows values, messages, errors, and output from Log blocks. Use Log blocks whenever you want to inspect intermediate results or troubleshoot workflows.
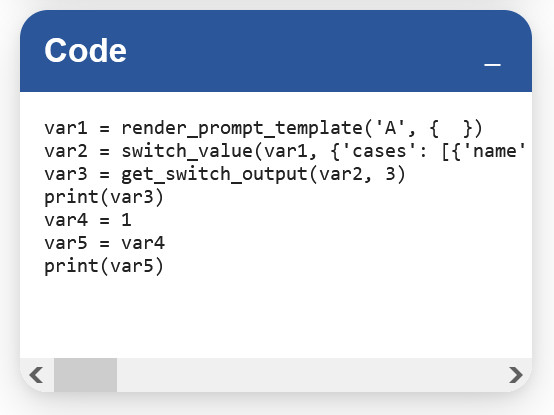
Shows generated or related execution information where available. This helps you understand what the visual graph is doing internally.
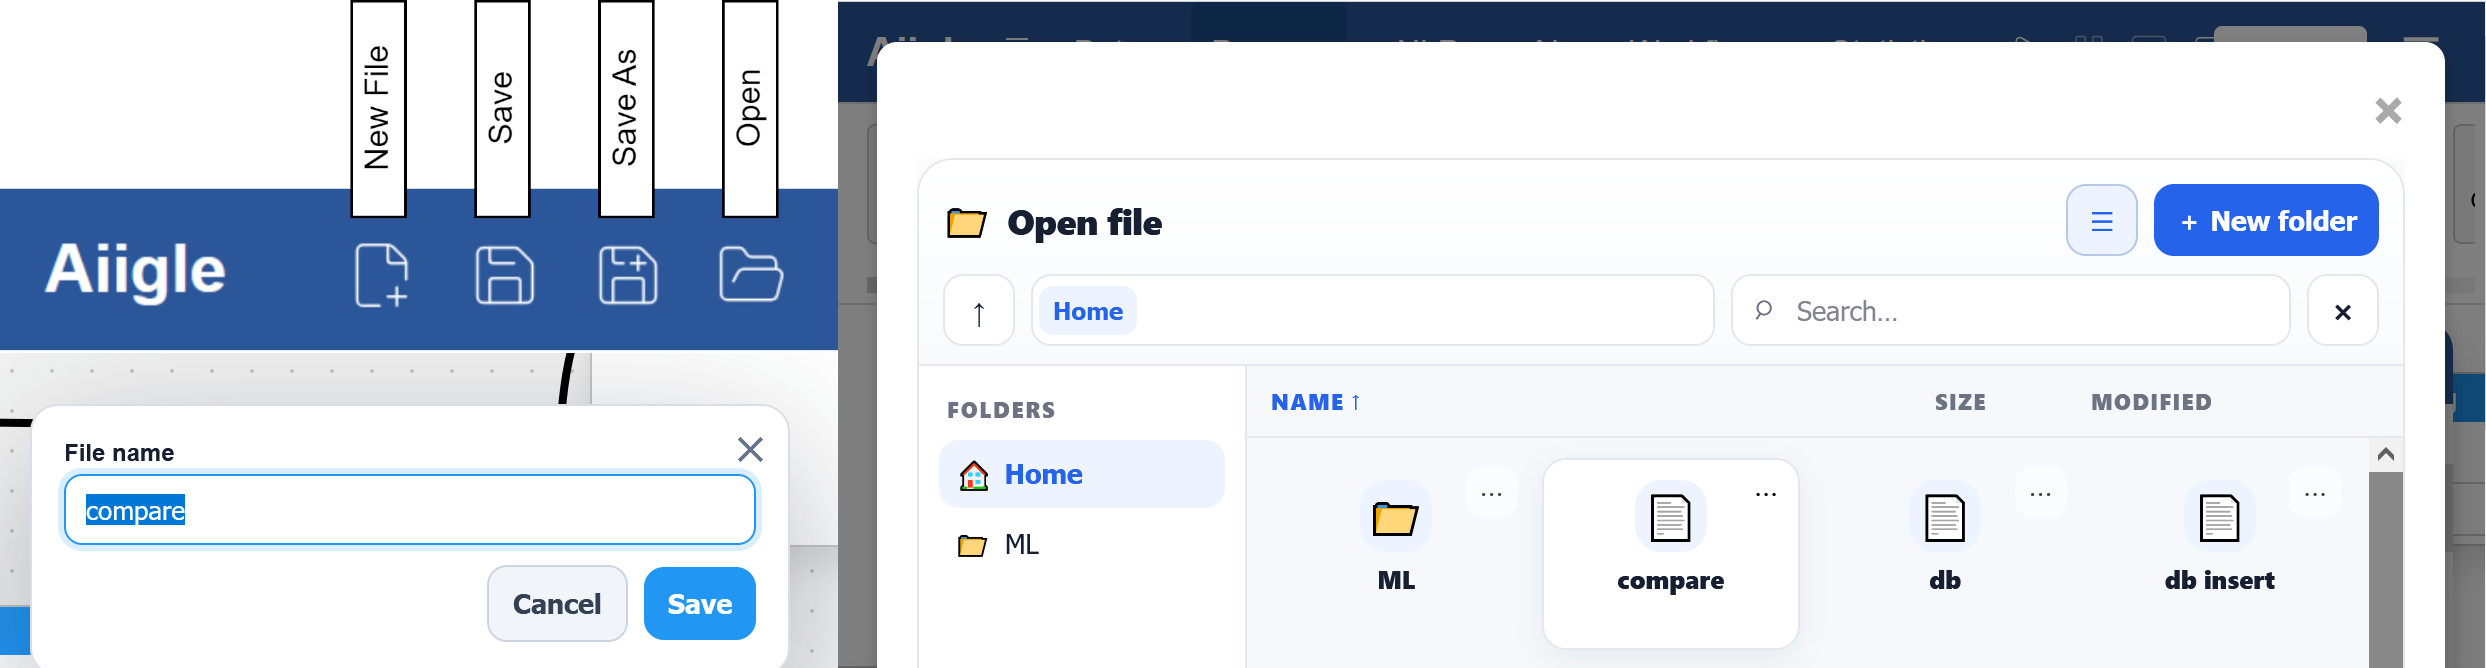
Use the file controls in the top bar to create, save, save as, and open workflows. A workflow stores the blocks, positions, connections, and block settings. If your graph uses external services, such as Moodle or OpenAI, make sure the required keys are configured before running it. Create a free account to store all your workflows.
Build two or three blocks first, run them, and only then add more steps.
Log blocks help you see what data looks like at each point in the workflow.
If a block does not run, verify that all required connected inputs receive data.
Check whether all connected inputs are available. If the block has a trigger input, it may be waiting for that trigger.
Add a Log block directly after the previous block to see whether data is already missing earlier in the graph.
Check the URL, API key, selected method, permissions, and whether the external service is reachable.